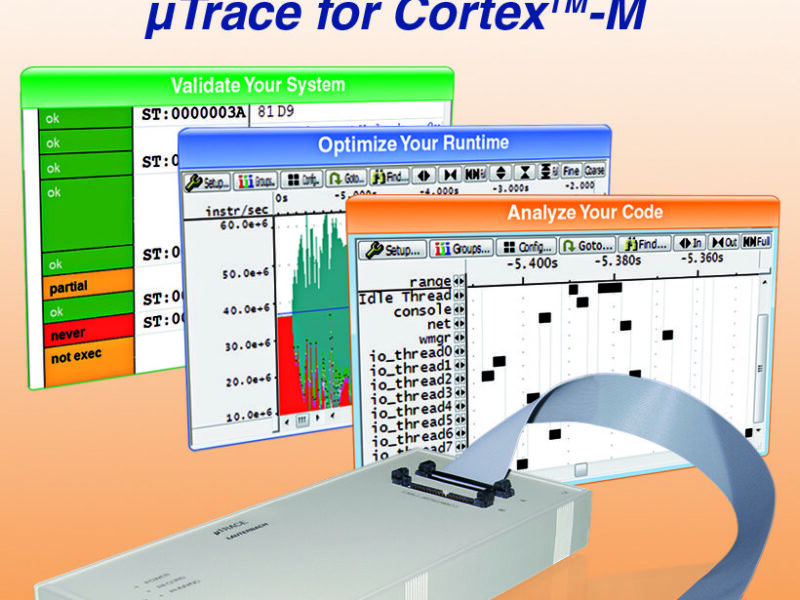
Debug and trace tool set for the Cortex-M family of MCUs
µTrace is a solution designed specifically for the ARM CortexM family, to be launched in August 2013. Through Lauterbach’s TRACE32®PowerView debug environment, the µTrace system provides developers with a powerful user interface for debugging and tracing. By using simple and complex breakpoints the developer can control the operation of the program and analyse the data in C and C++. The tool supports accesses to memory and peripherals during program runs.
“We are very sure engineers will welcome this development,” said Barry Lock, UK Manager at Lauterbach. “The low power and high performance of Cortex devices are proving very attractive to developers. An all in one debug and trace solution for the entire Cortex family will help simplify tool choice, reduce costs and allow more design freedom with regards to device selection.”
The µTrace uses USB3 connection to the host and can connect to the target via JTAG, serial wire debug or cJTAG (IEEE 1149.7), and is supplied with adaptors for 10/20/34 pin half size and 14/20 pin JTAG connectors. Many other adaptors are also available for use with standard development boards. When used in tracing mode the tool has an internal 256 Mbyte memory buffer but it can also be set to stream data to the host if the user needs to collect the program flow data for longer periods.
“The µTrace uses a new, compact design which is different to our traditional approach of making systems modular and expandable,” said Barry Lock. “The result is a more attractive system cost, but it remains very much an advanced debug tool that will help accelerate development, optimise performance and ensure reliable code in the field. “
More at; www.lauterbach.com/1658
 If you enjoyed this article, you will like the following ones: don't miss them by subscribing to :